Cost optimization is a constant concern in cloud architecture. Cloud vendors often obfuscate costs or frame costs in unhelpful ways. Changing the way you think about cloud computing costs can be a really helpful way towards getting your bill under control. In this post I discuss a strategy for deciding how many instances to reserve when auto-scaling.
The first trick cloud marketers pulled off was to get everyone thinking about computing costs using the on-demand pricing as a baseline. This lets them frame reserved instances as a discount or a savings; they are giving you a deal!
Avoid this style of thinking.
Let's look at some pricing examples.
Prices from Vantage's EC2 Instance Comparison tool. EC2 instances running Linux in us-east-2 (Ohio), monthly cost. Reserved costs are "no upfront" for one year. Actual prices subject to change. Excluding EBS, data transfer, and other expected costs.
| Type | GiB RAM | #vCPU | On-Demand | Reserved | Savings |
| t4g.nano | 0.5 | 2 | $3.07 | $1.90 | 62% |
| t3.small | 2 | 2 | $15.18 | $9.49 | 63% |
| t3.medium | 4 | 2 | $30.37 | $19.05 | 63% |
| c5.4xlarge | 32 | 16 | $496.40 | $312.44 | 63% |
| i3.xlarge | 30.5 | 4 | $227.76 | $156.22 | 69% |
| i2.xlarge | 30.5 | 4 | $622.69 | $309.52 | 50% |
Framing the pricing this way tends to make on-demand the default choice. It looks like you have the option to save money, if you can predict your usage and reserve your instances.
However, if I flip the narrative to make reserved the baseline, this changes:
| Type | GiB RAM | #vCPU | Reserved | On-Demand | Markup |
| t4g.nano | 0.5 | 2 | $1.90 | $3.07 | 1.6 |
| t3.small | 2 | 2 | $9.49 | $15.18 | 1.6 |
| t3.medium | 4 | 2 | $19.05 | $30.37 | 1.6 |
| c5.4xlarge | 32 | 16 | $312.44 | $496.40 | 1.6 |
| i3.xlarge | 30.5 | 4 | $156.22 | $227.76 | 1.5 |
| i2.xlarge | 30.5 | 4 | $309.52 | $622.69 | 2.0 |
Now I'm thinking, "Ouch those on-demand instances are pricey!" I'd need to justify paying a premium over the "default" option of a reserved instance. If I can't predict my usage, then I'm going to pay a premium.
Is this mental model better? No, not really. It's just another way marketing can frame prices to stir up emotions. Let's find a better model.
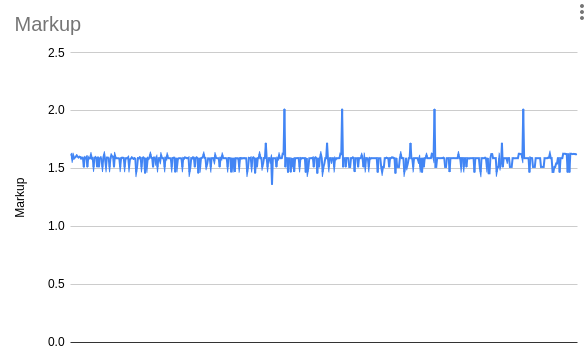
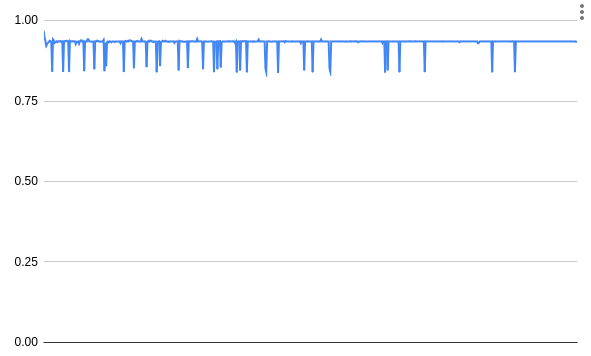
About 92% of the EC2 instances available show an on-demand markup between 1.5x and 1.7x. The mean and median markup is 1.6x. I'm not certain why AWS uses this number. It could be based on utilization rates, desired profit margins, or an artifact of financial risk management. Whatever the cause, knowing this "constant" can greatly speed up thinking about cost optimizations.
I included i2.xlarge in the table as it's clearly an outlier. The entire i2 family (xlarge, 2xlarge, 4xlarge, and 8xlarge) use a 2x markup. You can see those as the four large spikes in the graph. I suspect the higher rate reflects that the i2 series is a "previous generation" instance and customers should migrate to new hardware. In this case, that's the i3 family, which all use a 1.5x markup. As customers migrate off this old hardware it will become harder and harder to support variable demand. If you're using these, please upgrade, the new instance types are much cheaper.
If we base our cloud-pricing mental model in reserved instances, then an on-demand instance (running 100% of the time) costs about 1.6 times more. Let's define this as a constant: the "on-demand markup" constant is 1.6. Under this model, a reserved instance costs 1 and an on-demand instance running 50% of the time costs 0.8 (I.E. half of the "on-demand markup" constant). These unit-less costs can help decide when it makes sense to use a reserved instance, and when an on-demand instance is better.
Unit-less values can be confusing to deal with, so I'll make up a unit "C" so you know we're talking about unit-less cost.
To get back to actual costs, just multiply by the reserved instance cost.
For example: 3.5 C for t3.median is $66.68 (3.5 C × $19.05 = $66.675) monthly.
It doesn't matter if those are all on-demand instances, or if some of them are reserved, we've abstracted that away.
Every pricing effort has a different starting place. Maybe you're running on-demand instances and looking to get a discount by running reserved instances to handle your baseline load. Maybe you're running a reserved instance fleet and you'd like to scale down when load is low, again reducing costs. In either case, you're going to want to find break even points.
We can figure out how many hours a day we can run an on-demand instance before its cheaper to just reserve it. This is easy to calculate with the on-demand markup constant:
1.6 C × N = 1 C × 24 hours
N = 24 hours ÷ 1.6
N = 15 hours
On-demand only makes sense if you can run the instance for less than 15 hours per day, otherwise reserved is cheaper. Or the other way, on-demand becomes viable if you can keep an instance off for at least 9 hours per day.
Each hour an on-demand instance runs costs 0.0667 C (1.6 C ÷ 24 hours = 0.0667 C per hour).
If you run an on-demand instance for 14 hours a day, one hour below the 15 hour break-even point, then you can save 0.0667 C.
If you only need it for five hours, then you're ten hours below and you save 0.667 C.
The opposite is also true, if you run an on-demand instance for 16 hours a day, one hour above the break-even point, then you're spending 0.0667 C more than if you had reserved it.
If you run an on-demand instance 100% of the time then the cost is 0.6 C (9 × 0.0667 C = 0.6 C) more than reserved (there's our 1.6x markup again).
If your load is more seasonal, you'll want to calculate the break even point in days:
1.6 C × N = 1 C × 365 days
N = 365 days ÷ 1.6
N ≈ 228 days
You'll need to turn your on-demand instance off at least 137 days per year to see a benefit. Each excess on-demand day costs 0.0044 C.
If your load pattern has both seasonal and daily patterns, you'll need to build a hybrid model.
It's tempting to use reserved instances for your baseline load and to use on-demand instances for the variable load. But this is not optimal! You may benefit from making the cut a little higher.
Consider the following simplified load pattern. It's a sinusoidal load centered on 100 requests per second (RPS) rising and falling 40 RPS through a single day. Your load pattern will be different, so treat the following as an example only.
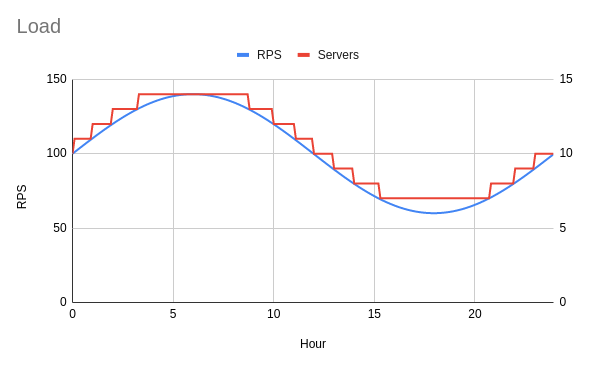
If each instance can handle ten RPS, then fourteen instances can handle the peak load and seven can handle the minimum load. You may expect the minimum to be six instances, as the minimum load is 60 RPS, but this is only momentarily true. As soon as the request rate rises, to say 60.1 RPS, you'll need to round up to seven instances. This is too brief to scale down to six instances. I've marked the number of required instances in red, which follows a step pattern.
To optimize cost, you'll want to determine how many instances can be turned off for nine hours or more. Remember, you won't see a cost savings if you run an on-demand instance for 15 hours or more. I counted the required instance counts throughout the day as:
| # of instances | hours |
| 7 | 24 |
| 8 | 18.5 |
| 9 | 16 |
| 10 | 14 |
| 11 | 11.9 |
| 12 | 10.1 |
| 13 | 8 |
| 14 | 5.5 |
My baseline load requires seven instances but I'll want to reserve nine instances, since each of those is needed for too many hours. The rest will be on-demand:
savings = (15 - 14) × 0.0667 C)
savings = (15 - 12) × 0.0667 C)
Now that we know the optimal strategy, we can contrast it with other strategies.
The "all on-demand" strategy will use auto-scaling, but doesn't reserve any instances. You should expect to save some money when it turns off unneeded instances but to overpay for the baseline load.
The "all reserved" strategy will reserve the maximum required instances and keep them all running. It's very easy to compute the cost of this strategy, each instance costs 1 C, and a total of 14 C for our example.
The "baseline" strategy will reserve instances for the minimum load and will use on-demand instances to auto-scale for the remaining load.
Finally, the "optimal" strategy reserves instances such that any running 15 hours a day or more are reserved and the rest are auto-scaling on-demand instances. Since we know 15 hours is the break even point, this should perform the best.
| Utilization | All on-demand | All reserved | Baseline | Optimal |
| 24 hrs | 1.6 C | 1 C | 1 C | 1 C |
| 24 hrs | 1.6 C | 1 C | 1 C | 1 C |
| 24 hrs | 1.6 C | 1 C | 1 C | 1 C |
| 24 hrs | 1.6 C | 1 C | 1 C | 1 C |
| 24 hrs | 1.6 C | 1 C | 1 C | 1 C |
| 24 hrs | 1.6 C | 1 C | 1 C | 1 C |
| 24 hrs | 1.6 C | 1 C | 1 C | 1 C |
| 18.5hrs | 1.23 C | 1 C | 1.23 C | 1 C |
| 16hrs | 1.07 C | 1 C | 1.07 C | 1 C |
| 14hrs | 0.93 C | 1 C | 0.93 C | 0.93 C |
| 12hrs | 0.81 C | 1 C | 0.81 C | 0.81 C |
| 10hrs | 0.65 C | 1 C | 0.65 C | 0.65 C |
| 8hrs | 0.53 C | 1 C | 0.53 C | 0.53 C |
| 5.5hrs | 0.36 C | 1 C | 0.36 C | 0.36 C |
| Totals | 19.98 C | 14 C | 12.56 C | 12.28 C |
As promised, the optimal strategy performs the best. I've shaded cells in red when they are above the 1 C cost of a reserved instance and green when we're getting a discount. This clearly shows when each strategy does well, and where it performs poorly.
Something else I hope jumps out here: auto-scaling with only on-demand instances is the most expensive option, about 43% worse than using a fixed-size reserved instance fleet. If you've got baseline load, you may be better off reserving instances than auto-scaling, if you only choose one.
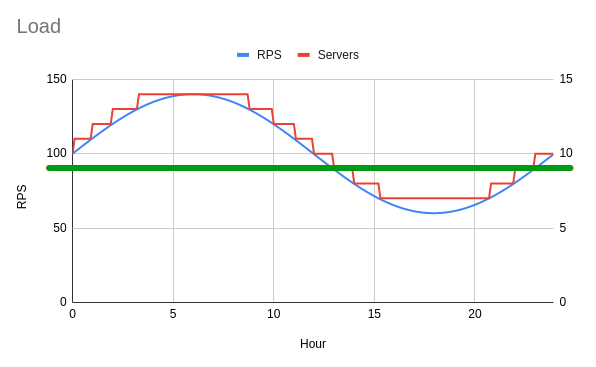
If all this math and numbers is too much, here's the solution visually. Draw a horizontal line through the graph at the point where exactly 15 hours per day are below the load curve. Divide these RPS by the load each instance can handle (10 RPS in this example). This is the number of instances you should reserve, the rest can be on-demand.
Can you tell the optimal strategy just from the shape of these load graphs?
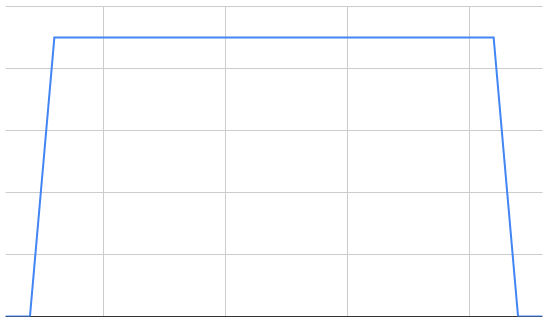
When load is flat: the best strategy is to reserve instances.
There's no opportunity to turn off instances so on-demand and auto-scaling won't help.
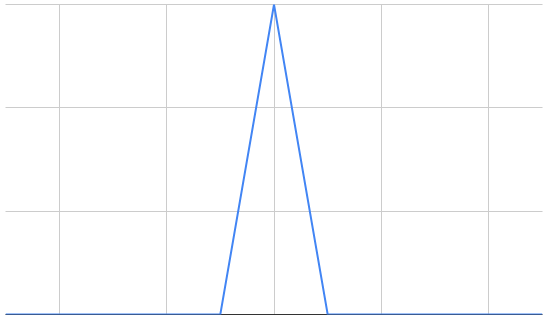
When load is extremely spiky: you can auto-scale, letting you save money on the off-hours.
When load is briefly low: auto-scaling won't save costs as you won't be able to turn off on-demand instances long enough.
Hopefully those weren't too challenging. These concepts can help visually assess where auto-scaling and on-demand instances can help.
In absolute terms, the estimated annual cost of the example would be:
| Instance type | All on-demand | All reserved | Baseline | Optimal |
| t4g.nano | $455 | $318 | $286 | $279 |
| t3.small | $2,275 | $1,594 | $1,430 | $1,398 |
| t3.large | $9,136 | $6,401 | $5,743 | $5,615 |
| c5.xlarge | $18,727 | $13,122 | $11,772 | $11,510 |
| c4.8xlarge | $176,425 | $123,621 | $110,905 | $108,433 |
These figures are obtained by multiplying the reserved instance cost back in. There's some discrepancy here as the on-demand markup isn't exactly 1.6x for all instances.
AWS also offers three-year reservations and reservations with different payment terms. I don't think these meaningfully change the previous analysis, but I'll talk through them.
Each of these options can further reduce the reserved instance price, which lowers the break-even point. This will reduce the number of on-demand instances you'll want to use, causing you to auto-scale less.
You've probably noticed that EC2 offers three year reservations as well, at an even further discount. I usually avoid these. Three years is a long time to lock in your capacity and there's a lot that can changes in that time. Here's some things to keep in mind:
Capacity planning is about predicting the future. You'll never be able to predict it perfectly, but some predictions are safer than others.
Amazon marketing considers full upfront reserved instances to be "discounts", where you can save by paying more up front. As before, we can shift our thinking and consider these to be markups, with full up front being the default option. Under this model, the no upfront reservation charges a premium to let you pay in installments.
Prepayment generally gets you a 6.7% discount (1 year reserved, no upfront vs full upfront), although there's some variation again:
I don't think these variants are too interesting from a DevOps perspective, it's just a question of finances. If you've got cash "burning a hole in your wallet", pay up front to see a cost savings.
Choosing full upfront will change the "on-demand markup" to 1.7x, so you'll want to adjust your models. The break even point on a daily basis is lowered to 14.1 hours, making it slightly less desirable to auto-scale.
If you over estimate your capacity needs, then you'll have too many reserved instances. Compared to an optimal allocation, you'll miss out on 0.0667 C savings for each instance-hour.
If you underestimate your capacity needs, then you'll have too few reserved instances. Compared to an optimal allocation, you'll overpay at 0.0667 C for each instance-hour.
If you experience growth, you may have an opportunity to reserve additional instances. But be careful about having too many reservations that end at different times of the year. At some point you'll need to end your usage of this instance type. Timing your instance type upgrade based on reservation expiration lets you maximize your value, but you'll want all your reservations to end at the same date.
Intentionally over-estimating capacity needs has it's own benefits. You'll have more stable costs if you use fewer on-demand instances. You can limit your worst case scenario costs by putting a cap on your auto-scaling. Using extra reserved instances can reduce that worst case cost. This is helpful if you need your projected budget to be close to your actual bill.
Something to watch out for is that on-demand instances may not always be available. All cloud providers have capacity limits, and sometimes the entire availability zone can reach these. This may be more common with smaller regions, uncommon instance types, or during certain busy times of the year. You're also more likely to see this with certain deployment patterns; like deploying to a full fresh set of instances, cutting traffic to the new set, and then terminating the old set. This pattern causes you to temporarily have twice the instance count.
I've ignored spot instances so far. These are harder to work with and harder to optimize (instance weighing can require careful application profiling, for example). The prices are more variable, so it's harder to reason about and model these costs. You also need to be OK if you're not able to get a spot instance when you need it, which works OK for background jobs but not for typical web server load.
"We strongly warn against using Spot Instances for these workloads or attempting to fail-over to On-Demand Instances to handle interruptions." -- Best practices for EC2 Spot
I hope I've helped explain the dynamics of EC2 pricing and made it a little easier to think about optimization strategies and their impact.
This sort of analysis should work on other cloud service that use similar billing models, but be sure to model your actual load and the markups.
Good luck!
Hello! I'm Robert Alexander, a freelance software developer and security consultant. This blog features some of my work and thoughts on software, the cloud, and security. You can get updates on my posts with your favorite RSS client or on Substack. I'm also on Mastodon.